Using NBA-API package Tutorial


Table of contents
Introduction
Basketball is one of the world's most popular sports. Because of the popularity, fans develop attachments to their favorite players, which may lead to comparisons in debates. In basketball, the most common and basic stats for comparison are points per game (PPG) and assists per game (APG).
The nba-api Python package is fantastic because it makes it easier to access NBA stats directly from the site. This allows people to concentrate on the data and analysis rather than doing too much behind the scenes.
For this package tutorial, a simple web app that compares the PPG and APG of any players from the previous season using a barplot is created. The packages used for this tutorial are:
- Nba-api: Accessing the basketball data
- Pandas: Manipulating the data gotten
- Seaborn: Visualizing the data
- Streamlit: Creating a web app
Building the App
- Installing the Package
pip install nba-api pandas streamlit seaborn - Importing the modules to be used
import streamlit as st
import pandas as pd
import matplotlib.pyplot as plt
from nba_api.stats.static import players
from nba_api.stats.endpoints import commonplayerinfo
import pandas as pd
import seaborn as sns
import warnings
warnings.filterwarnings('ignore')
- Getting Player IDs
To accomplish this, we use the 'players' module and simply return the player's ID. Defining a function will be done throughout this process to avoid repeating this step multiple times.
def find_player_id(name):
    """
    A function to return the id of a given player
    """
    player_name = players.find_players_by_full_name(name)
    return player_name[0]['id']
- Getting Player Data
After obtaining the ID, the next step will be to obtain the player data that will be used for the web-app. To accomplish this, we use the commonplayerinfo function, which returns a player's most basic stats, such as [PLAYER ID, PLAYER NAME, TimeFrame, PTS, AST, REB, PIE], which we convert to a dataframe. To avoid repetition, a function is defined once more.
def get_player_data(id):
    player_id = commonplayerinfo.CommonPlayerInfo(id)
    player_id_df = player_id.player_headline_stats.get_data_frame()
    res = pd.DataFrame(player_id_df)
    return res
Because the functions defined above can only return data for a single player, another function is defined to be able to get multiple players concurrently and place the results in a list.
def edit_multiple_player_id(player_list):
    """
    A function to get the player id of a list of players
    """
    mood = []
    for i in player_list:
        oid = find_player_id(i)
        mood.append(oid)
    return mood
- Creating the Dataset for Visualization
A list of player IDs is returned which is then used to create the dataset used for the visualization of the data.
def edit_make_dataset(player_dataset):
    result = pd.DataFrame()
    for i in player_dataset:
        each_player = get_player_data(i)
        result = pd.concat([result, each_player])
    return result
- Plotting the Viz
The next step is to plot the visualization. A bar plot is used for a simple visualization that allows for easy understanding of the data.
def plot_viz(viz_dataset):
    sns.set_theme(style="whitegrid")

    # Initialize the matplotlib figure
    f, ax = plt.subplots(figsize=(6, 6))

    # Points per Game
    sns.set_color_codes("pastel")
    sns.barplot(x="PTS", y="PLAYER_NAME", data=viz_dataset, label="PPG", color="b")

    # Assist per game
    sns.set_color_codes("muted")
    sns.barplot(x="AST", y="PLAYER_NAME", data=viz_dataset, label="APG", color="b")

    # Add a legend and informative axis label
    ax.legend(ncol=2, loc="lower right", frameon=True)
    ax.set(xlim=(0, 30), ylabel="Players", xlabel="Per Game Stats")
    sns.despine(left=True, bottom=True)
    return f, ax
- Nesting all the Functions
The final function defined will nest all the previously defined functions and run through them from top to bottom
def everything(data):
    final_player_id = edit_multiple_player_id(player_list=data)
    print("Gotten Player ID")

    print("Creating Dataset ... ")
    final_player_dataset = edit_make_dataset(player_dataset=final_player_id)
    print("Created Dataset")

    print("Plotting Visualization ...")

    f, _ = plot_viz(viz_dataset=final_player_dataset)
    return f
This final function will work on the user input. As we need a list for our functions to work, this converts the input of the user to a list to enable it to work.
def convert(names):
    name_list = [name.strip() for name in names.split(",")]
    return name_list
A streamlit text input is then created and with that, the work is all done.
user_input = st.text_input(" ")

if user_input:
       user_str = convert(user_input)
       everything(user_str)
       st.pyplot()
Running the Web App
All that is needed now is to run the python file and we have a functional web app that creates a visualization and is available for usage.
streamlit run "filename".py
Conclusion
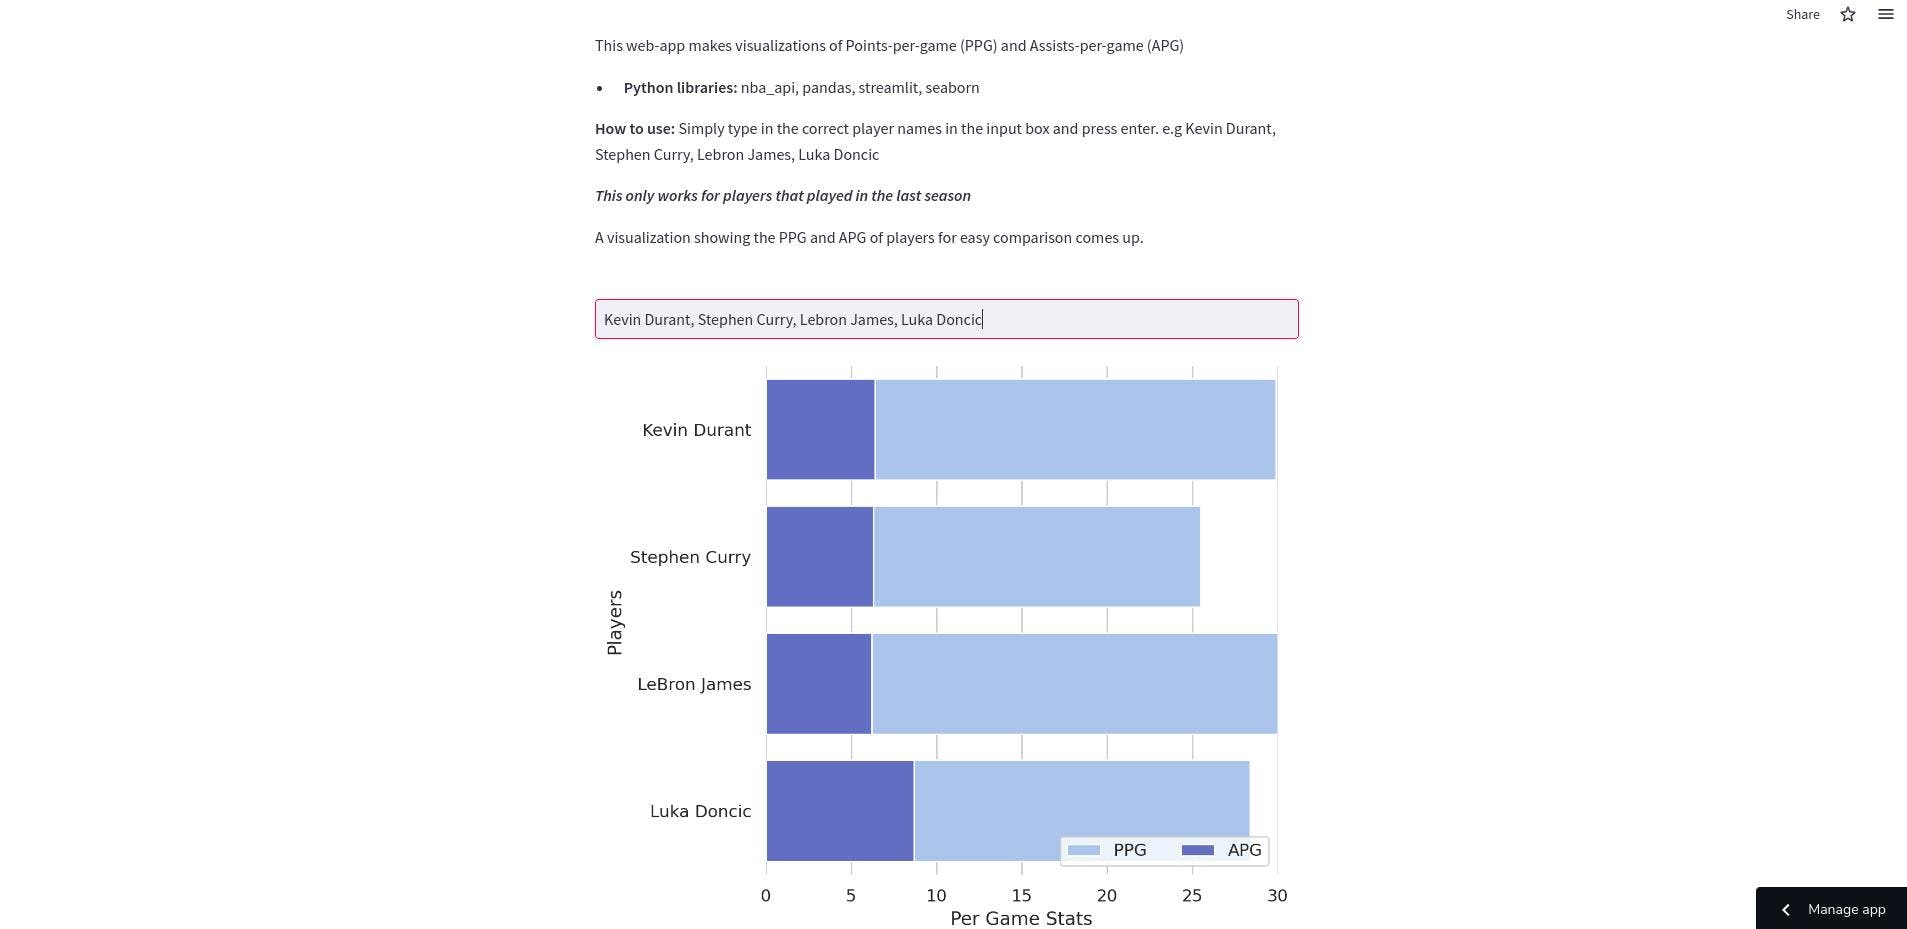
We just built an app to display the basic stats of Basketball players using seaborn and matplotlib. The webpage will look like this when completed.
You can follow this to learn how to deploy the app on Github.
A live demo of the code is available here and the code to this tutorial can be found at this github repo. Thank you for reading.